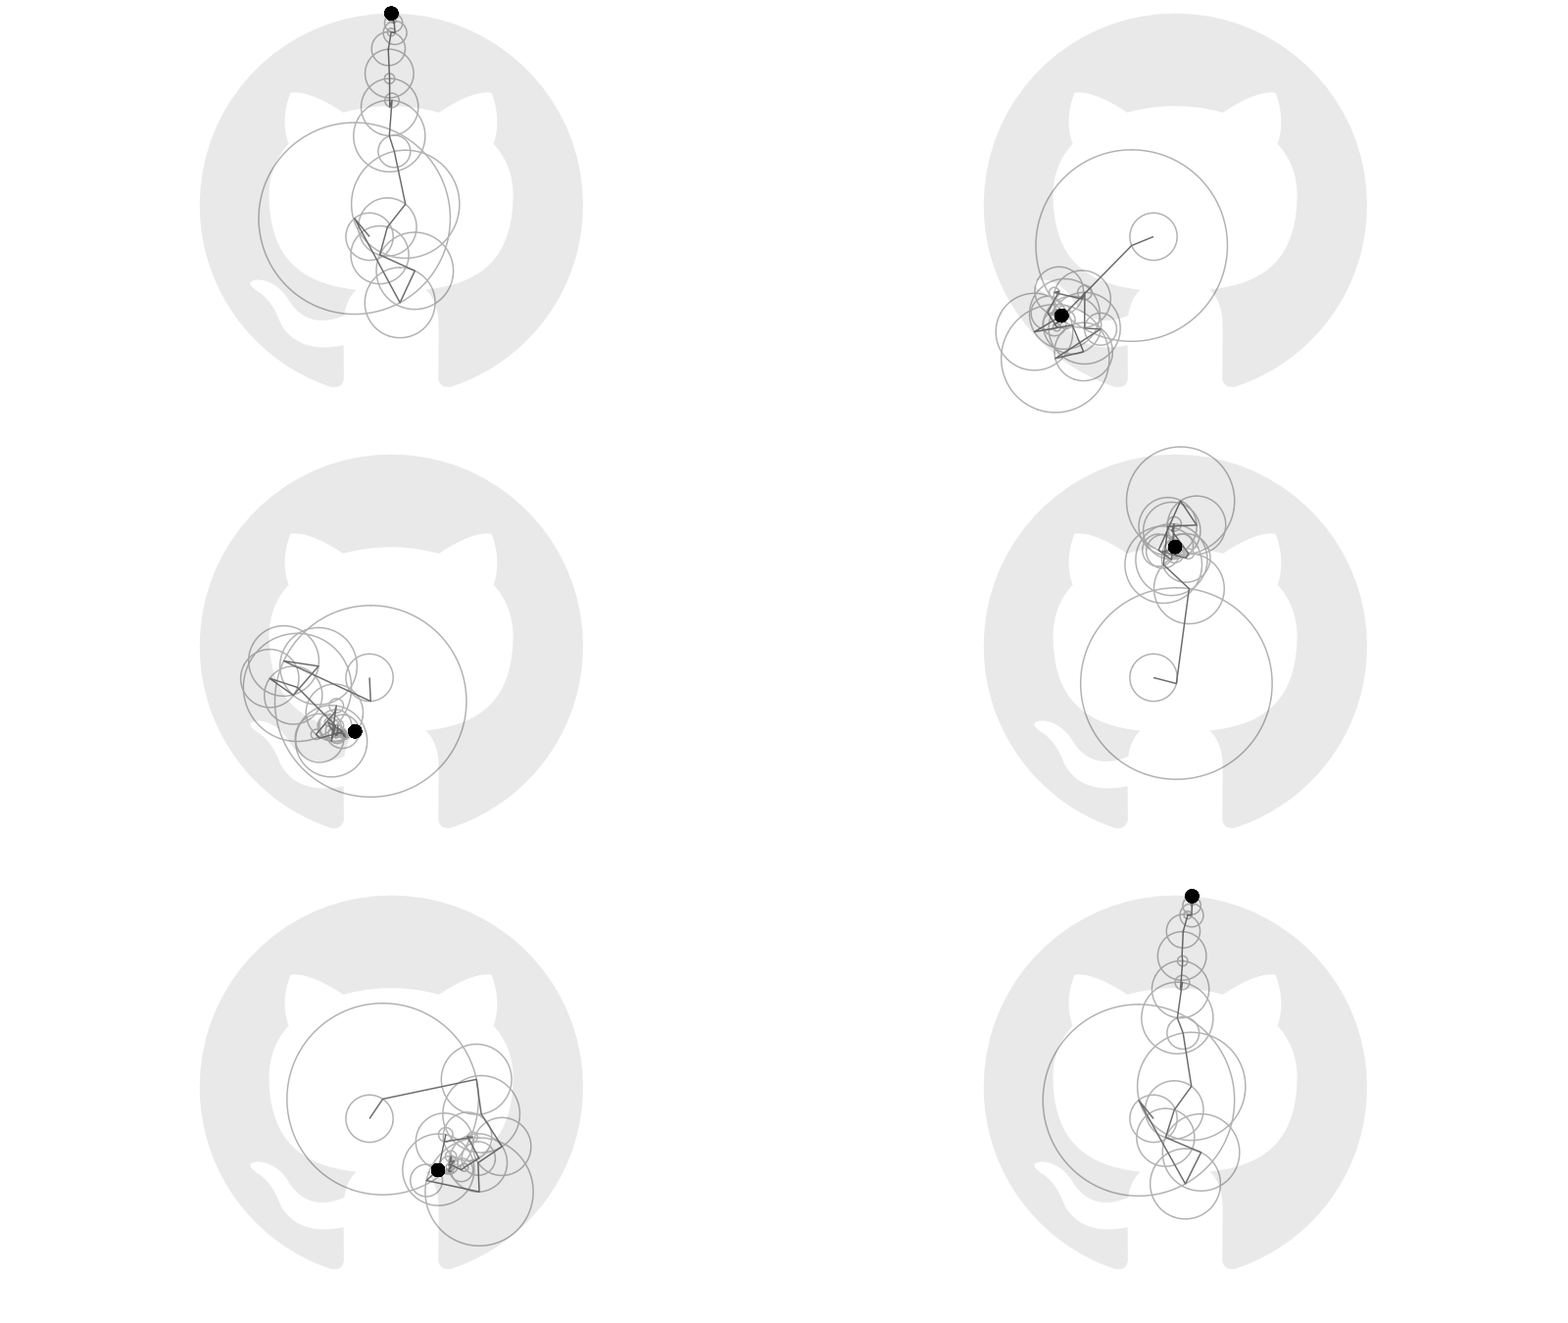
Earlier this year Grant Sanderson, creator of the YouTube channel 3blue1brown, posted a video explaining how Fourier series approximate periodic functions using sums of sines and cosines. In the video and its companion, Grant animates sets of vectors that rotate on circular orbits and, when summed together, reproduce a range of images defined by closed curves.
Consider, for example, the boundary of GitHub’s logo:
Let \(\gamma:[0,1]\to\mathbb{R}^2\) be the closed curve in \(\mathbb{R}^2\) defining the logo’s boundary.
Suppose there is an integer \(n\) such that
$$\gamma(t) = \sum_{k=-n}^n \gamma_k(t)$$
for some set of circular orbits \(\gamma_{-n},\ldots,\gamma_n:[0,1]\to\mathbb{R}^2\) and for all times \(t\in[0,1]\).
(Negative and positive subscripts correspond to clockwise and anti-clockwise orbits.
Both may be necessary to reconstruct \(\gamma\).)
Each orbit \(\gamma_k\) has time \(t\) position defined by the vector
$$\gamma_k(t) = \begin{bmatrix} r_k \cos(2\pi k t + \theta_k) \\ r_k \sin(2\pi k t + \theta_k) \end{bmatrix}$$
for some radius \(r_k\), angular speed \(2\pi k\) rad/s and initial phase \(\theta_k\).
Consequently, the curves \(x,y:[0,1]\to\mathbb{R}\) defining the horizontal and vertical components of \(\gamma\) must satisfy the system
$$\begin{align} x(t) &= \sum_{k=-n}^n r_k\cos(2\pi k t + \theta_k) \\ y(t) &= \sum_{k=-n}^n r_k\sin(2\pi k t + \theta_k) \end{align}$$
of identities.
Let \(z:[0,1]\to\mathbb{C}\) be the curve with \(z(t)=x(t)+iy(t)\) for all \(t\in[0,1]\).
Euler’s formula gives
$$\begin{align} z(t) &= \sum_{k=-n}^n r_k(\cos(2\pi k t + \theta_k) + i \sin(2\pi k t + \theta_k)) \\ &= \sum_{k=-n}^n r_k \exp(2\pi i k t + i\theta_k) \\ &= \sum_{k=-n}^n c_k \exp(2\pi i k t), \end{align}$$
where each Fourier coefficient \(c_k=r_k\exp(i\theta_k)\) has modulus \(\lvert c_k\rvert=r_k\) and (principal) argument \(\mathrm{Arg}(c_k)=\theta_k\).
Now, notice that
$$\begin{align} \int_0^1 z(t) \exp(-2\pi i k t)\, \mathrm{d}\,t &= \int_0^1\left(\sum_{j=-n}^n c_j \exp(2\pi i j t)\right)\exp(-2\pi i k t)\, \mathrm{d}\,t \\ &= \int_0^1c_k\, \mathrm{d}\,t + \sum_{j\not=k} c_j \int_0^1 \exp(2\pi i (j - k)t)\, \mathrm{d}\,t \\ &= c_k \end{align}$$
for each \(k\) because
$$\int_0^1 \exp(2\pi i (j - k)t)\, \mathrm{d}\,t = 0$$
for all integers \(j\not=k\) by the \(2\pi i\)-periodicity of the complex exponential function.
Thus
$$c_k = \int_0^1 z(t) \exp(-2\pi i k t)\, \mathrm{d}\, t,$$
which can be calculated using Riemann sums given sample points along the component curves \(x\) and \(y\).
Doing this calculation for each \(k\), and computing the corresponding moduli \(r_{-n},\ldots,r_n\) and arguments \(\theta_{-n},\ldots,\theta_n\), provides enough information to generate the animation below.
